Advanced OPM: Social Summary Dashboard
When navigating to Analytics > Dashboards, you’ll find an out-of-the-box dashboard designed to make Social reporting easy to access and understand. On the left side of the Dashboards screen, under Account Dashboards, select Social Summary to open and view key social performance metrics at a glance.
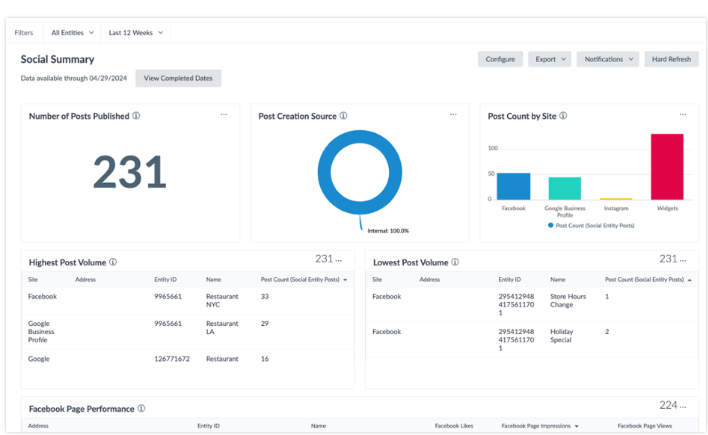
Within these dashboards, you can apply filters to view specific entities or date ranges, allowing you to analyze social performance at a more detailed level.
Each insight includes a caption phrased as a question, helping you quickly understand what the data represents and what question it’s answering.
Because this is a standard, out-of-the-box dashboard, it can't be edited directly. However, you can duplicate the dashboard if you’d like to make customizations tailored to your business—such as modifying captions or adjusting visualizations to better suit your needs.
Multi-publisher Post Activity
The first section of the Social Summary dashboard provides a high-level view of your overall post activity. It includes key insights such as:
- The number of entity posts published, broken down by unique publisher and location.
- Where posts are being created—whether through internal tools like OPM or directly on the publisher’s platform.
- Which publishers (Facebook, Google, Instagram) are receiving the most content.
- Location-level posting activity, highlighting which locations are publishing the most and least so you can identify potential gaps in your social strategy across your business footprint.
Facebook Page Performance
This section of the dashboard focuses on Facebook Page performance across your locations.
- It highlights which pages are performing well based on metrics like likes, impressions, page clicks, page reach, and page views, with several insights also showing growth trends over time. You can adjust the sorting to view lowest-performing pages as well, helping identify which locations may need additional support or strategy refinement.
- You'll also find demographic insights, including Facebook likes and impressions broken down by age, gender, and location, along with a breakdown of organic vs. paid page likes. This data can be useful for audience targeting and refining your social messaging strategy.
- The Facebook Page Reach Growth graph allows you to compare reach over time against a previous period, while the Page Click Growth graph reveals changes in user engagement with your page. These trends help quantify the impact and value of your social content.
- Additional reports, like New Likes vs. Unlikes per Week and Negative Actions Taken, offer insight into how well your content resonates with audiences and where there may be opportunities to improve post effectiveness.
Facebook Post Performance
The final section of the dashboard provides detailed insights into how your individual Facebook posts are performing.
- It begins with a chart highlighting the top-performing posts by title and URL, ranked by impressions, reach, and clicks. This makes it easy to see which posts are generating the most visibility and engagement.
- Next, you'll find a daily post reach graph, showing how reach trends over time and breaking down views attributed to paid versus organic content. Adjacent bar graphs display engagement by day, helping you identify the most effective days and times to post based on audience response.
- Following that, you’ll see data on posts with the highest number of reactions, alongside insights into posts that received negative reactions or negative actions taken. These reports can help you adjust your content strategy to avoid repeating posts that don’t resonate well with your audience.
- The final report presents a clear breakdown of paid vs. organic reach, offering a valuable perspective on how your paid efforts are performing. This can help you assess whether your ad spend is delivering meaningful results and inform future boosting decisions.
Instagram Page Performance
Note: Instagram posting is currently available to resellers only. If you're a non-reseller, this section may show “Not enough data” or indicate that access is restricted.
The Instagram Page Performance section provides an overview of how your brand pages are performing on Instagram. The first table highlights which pages have the highest impressions, reach, and views.
You'll also find charts tracking new followers per day and reach per day, along with reports that show engagement rates and the number of unique accounts interacting with your content. These insights help you understand your opportunity for audience growth and engagement.
Additional graphs display Instagram page actions by type, such as saves, shares, and other interactions. Growth charts further break down metrics like engagement, likes, and comments, helping you assess how well your content is resonating with followers over time.
Instagram Post Performance
This section starts with a summary of overall post performance, including impressions and reach across your Instagram content.
Further reports show engagement rate by post, the total number of interactions, and how many saves each post received. These metrics are useful for identifying what types of posts are most effective and where content may need to be adjusted to better engage your audience.
Apple Post Performance
Apple provides a single supported metric for Apple Showcase posts: Apple Showcase Taps. This report shows how many taps each post received, broken down by location. This metric helps evaluate interest in your Apple Showcase content, even if reporting is limited.
Note: If a post receives only a few taps, Apple may not return data for privacy reasons.