Viewing and Understanding Analytics Dashboards
To get to Analytics Dashboards, go to Meevo > Marketing > Online Presence Management or type onlinepresencemgmt into the Convobar and select Analytics.
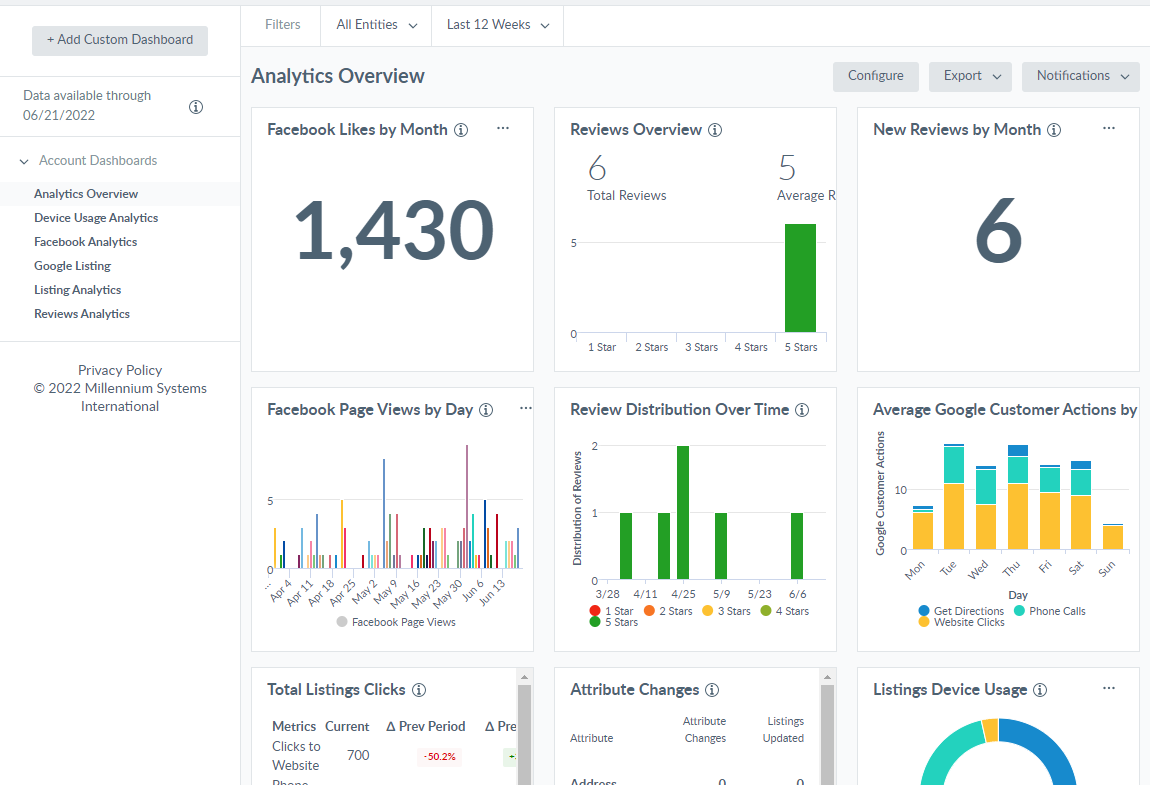
There are two types of dashboards in Online Presence Management:
Account Dashboards
Account dashboards are the out-of-the-box dashboards that provide data on a number of different elements, such as device usage, Facebook analytics, and more.
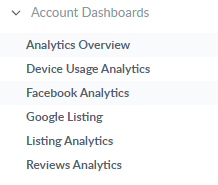
The following Account Dashboards are available out-of-the-box:
- Analytics Overview: This dashboard provides an overview of important metrics that you should always be interested in tracking. You can view data on Listings, Reviews, Clicks, and more.
- Device Usage Analytics: Here, you can view metrics on the number of times your listing was viewed, according to device type.
- Facebook Analytics: This dashboard is where you can view listing activity that is specific to Facebook, such as monthly likes, likes per day, and more.
- Google Listing: These metrics are specific to Google, such as Google phone calls by hour, Google views on search and maps, and more.
- Listing Analytics: This dashboard provides overall metrics on the listing itself, such as the number of profile views, listing clicks, listing searches, and more.
- Reviews Analytics: This dashboard presents review-related metrics, such as daily rolling average ratings, a reviews overview that lists total reviews and average reviews, and more.
Custom Dashboards
Custom / personal dashboards are dashboards that you create in order to target specific metrics that you wish to track.
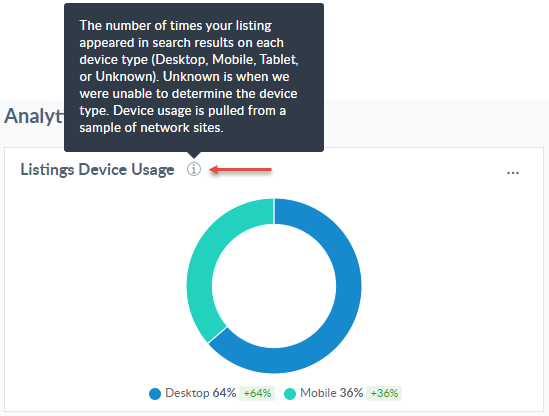
Within each dashboard are tiles that present various data points. Within each tile is an "information" icon (a little "i") that appears when you hover the mouse over the tile. You can select this icon for more details on that metric.
To filter the Analytics Dashboards
The Filters options appear across the top of Online Presence Analytics:
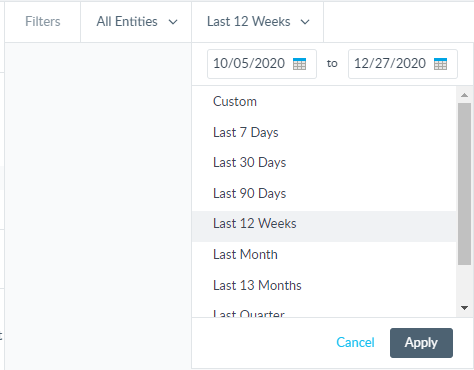
- All Entities: In Central Office, you can use this drop-down to filter the data to a specific location (entity). Otherwise, All Entities means you are viewing aggregated data across all locations.
-
Last 12 Weeks: You can filter the data according to a specific date or date range. Make your selections and select Apply to apply the date range.